Ichimoku Cloud Strategy: Reading the Kumo and Automating Entries
Master all five Ichimoku lines, trade cloud bias and TK crosses, and use an AI agent that scores confluence before entering.
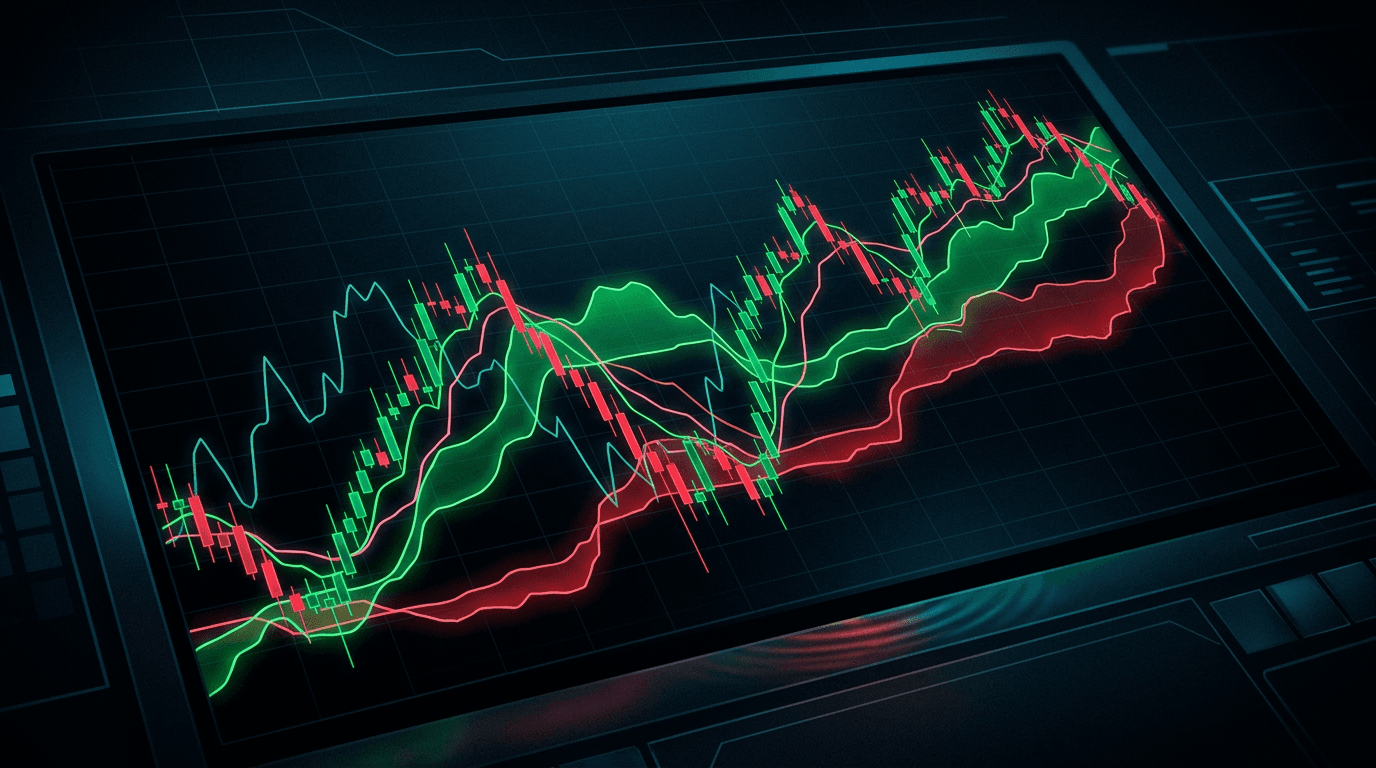
Ichimoku Cloud Strategy: Reading the Kumo and Automating Entries
Most traders glance at the Ichimoku Cloud, see five lines and a colored blob, and move on. That's a mistake. Ichimoku is one of the few indicators that encodes trend direction, momentum, support/resistance, and confirmation into a single framework — all on one chart, all derived from price alone.
The problem isn't complexity. It's that traders cherry-pick one signal (usually the TK cross) and ignore the rest of the system. A bare TK cross inside the cloud is a low-quality signal. A TK cross above a thick bullish cloud, with Chikou cleared above price, is a completely different trade. The system is designed to be read as a whole, and that's exactly what makes it ideal for an AI agent that can score every condition simultaneously and only enter when enough of them align.
What you'll learn:
- The exact calculation behind all five Ichimoku components and what each one tells you
- How to read cloud bias and why cloud thickness matters
- The TK cross entry and Chikou span confirmation logic
- A copy-paste Pine Script v6 implementation that plots the system and flags confirmed signals
- A signal-strength grading table based on how many conditions align
- How to configure a reasoning agent that scores setups before committing capital
- The most common Ichimoku mistakes and how to avoid them
The Five Components, Calculated Precisely
Ichimoku Kinko Hyo was developed by Japanese journalist Goichi Hosoda and published in 1969 after roughly 30 years of manual testing. Every component is a midpoint average — not a mean of closing prices, but a midpoint of the high-low range over a given period. That distinction matters: midpoint averages are less sensitive to closing-price noise and respond to the full range of traded prices.
Tenkan-sen (Conversion Line): (9-period high + 9-period low) / 2
This is the fast line. On daily charts it covers roughly two trading weeks. It reacts quickly to price and functions as a short-term momentum signal. When price is above Tenkan, short-term momentum is bullish.
Kijun-sen (Base Line): (26-period high + 26-period low) / 2
The slow line, covering roughly one trading month on daily charts. It acts as a dynamic support/resistance level and is the reference for the TK cross. A flat Kijun signals consolidation; a rising Kijun signals trend.
Senkou Span A: (Tenkan-sen + Kijun-sen) / 2, plotted 26 periods ahead.
One edge of the cloud. Because it's plotted forward, you can see future support/resistance before price gets there.
Senkou Span B: (52-period high + 52-period low) / 2, plotted 26 periods ahead.
The other edge of the cloud, based on the longest lookback. It moves slowly and represents stronger historical support/resistance. The area between Span A and Span B is the Kumo cloud.
Chikou Span (Lagging Span): Current closing price plotted 26 periods back. This is the confirmation line. When Chikou is above the price candles from 26 periods ago, it confirms bullish momentum. This is the most frequently ignored component and the one that filters the most false signals.
The standard settings are 9 / 26 / 52, derived from the six-day Japanese trading week Hosoda used. On a five-day Western trading week, some traders adjust to 7 / 22 / 44 or 10 / 30 / 60, but the original settings remain the most widely watched and therefore the most significant from a market-microstructure perspective.
Reading Cloud Bias: More Than Just "Price Above Cloud"
The most basic Ichimoku signal is cloud bias: price above the Kumo is bullish, price below is bearish, price inside the cloud is neutral (and dangerous to trade directionally).
But cloud bias has three layers of nuance most traders miss.
Cloud color: When Span A > Span B, the cloud is green (bullish). When Span B > Span A, the cloud is red (bearish). A price above a green cloud is a stronger bullish signal than price above a red cloud, because the forward-projected cloud itself is in agreement with the directional bias.
Cloud thickness: A thick cloud means stronger support/resistance. If price is approaching a thick cloud from below, expect more resistance than a thin cloud. Conversely, a price that has already broken through a thick cloud has demonstrated significant buying pressure.
Kumo twist: A point where Span A and Span B cross in the future is called a Kumo twist. This signals a potential trend change ahead — before price even gets there. Watching for upcoming twists lets you anticipate rather than react.
The TK Cross and Chikou Confirmation
The TK cross occurs when Tenkan-sen crosses Kijun-sen. A bullish TK cross is when Tenkan crosses above Kijun; bearish is the reverse.
On its own, a TK cross is a weak signal. Hosoda's system was designed so that a TK cross is only traded when it occurs in the right context. There are three grades of TK cross:
- Weak signal: TK cross occurs inside the Kumo cloud. Price is in a congestion zone; the signal has low follow-through probability.
- Neutral signal: TK cross occurs on the opposite side of the cloud from the cross direction (e.g., a bullish TK cross below the cloud). Momentum is improving but the trend structure hasn't confirmed.
- Strong signal: TK cross occurs on the correct side of the cloud (bullish cross above cloud, bearish cross below cloud) with Chikou also clear of price history on the same side.
The Chikou confirmation works like this: for a bullish trade, look back 26 periods on the chart and check whether the Chikou span (today's close plotted there) is above the price candles at that historical point. If it is, there's no overhead price resistance in the recent past, and the bullish momentum reading is unobstructed.
This is the logic that separates Ichimoku from simpler crossover systems like the MACD crossover strategy — every signal comes with a built-in multi-condition confirmation framework.
Signal Strength Grading Table
The following table grades Ichimoku setups by the number of conditions that align. Use this as a filter before entering any trade.
| Conditions Met | Signal Grade | Suggested Action |
|---|---|---|
| TK cross only | ⭐ Weak | Avoid or paper trade only |
| TK cross + price on correct side of cloud | ⭐⭐ Moderate | Reduce position size, tight stop |
| TK cross + correct cloud side + green/red cloud color aligned | ⭐⭐⭐ Good | Standard position size |
| TK cross + correct cloud side + cloud color + Chikou clear | ⭐⭐⭐⭐ Strong | Full position size |
| All above + higher-timeframe cloud agrees | ⭐⭐⭐⭐⭐ Highest | Full size, wider stop, hold for Kijun trail |
A "4-star" or "5-star" setup occurs far less frequently than a bare TK cross, but the hit rate and risk/reward profile improve substantially. This kind of multi-condition scoring is exactly what a reasoning agent can evaluate in milliseconds across dozens of instruments.
Pine Script v6 Implementation
The following Pine Script v6 code plots all five Ichimoku components and marks confirmed bullish and bearish TK crosses (those meeting at least the 3-star criteria: cross on correct side of cloud with matching cloud color).
//@version=6
indicator("Ichimoku Cloud + TK Cross Signals", overlay=true)

// --- Inputs ---
tenkanLen   = input.int(9,  "Tenkan-sen Length")
kijunLen    = input.int(26, "Kijun-sen Length")
senkouBLen  = input.int(52, "Senkou Span B Length")
displacement = input.int(26, "Cloud Displacement")

// --- Component Calculations ---
tenkan  = (ta.highest(high, tenkanLen)  + ta.lowest(low, tenkanLen))  / 2
kijun   = (ta.highest(high, kijunLen)   + ta.lowest(low, kijunLen))   / 2
spanA   = (tenkan + kijun) / 2
spanB   = (ta.highest(high, senkouBLen) + ta.lowest(low, senkouBLen)) / 2
chikou  = close

// --- Plots ---
plot(tenkan,              "Tenkan-sen",  color=color.new(color.red, 0),    linewidth=1)
plot(kijun,               "Kijun-sen",   color=color.new(color.blue, 0),   linewidth=2)
plot(chikou,              "Chikou Span", color=color.new(color.teal, 0),   linewidth=1, offset=-displacement)
spanAPlot = plot(spanA,   "Span A",      color=color.new(color.green, 0),  offset=displacement)
spanBPlot = plot(spanB,   "Span B",      color=color.new(color.red, 0),    offset=displacement)

fill(spanAPlot, spanBPlot,
     color = spanA >= spanB
             ? color.new(color.green, 80)
             : color.new(color.red, 80),
     title = "Kumo Cloud")

// --- Signal Conditions ---
// Cloud edges at current bar (not displaced)
cloudTop    = math.max(spanA, spanB)
cloudBot    = math.min(spanA, spanB)
cloudBull   = spanA >= spanB   // green cloud

// TK cross
tkBullCross = ta.crossover(tenkan, kijun)
tkBearCross = ta.crossunder(tenkan, kijun)

// Confirmed bullish: cross above cloud, cloud is green
bullConfirmed = tkBullCross
             and close > cloudTop
             and cloudBull

// Confirmed bearish: cross below cloud, cloud is red
bearConfirmed = tkBearCross
             and close < cloudBot
             and not cloudBull

// --- Signal Markers ---
plotshape(bullConfirmed, title="Bull TK Cross", style=shape.triangleup,
          location=location.belowbar, color=color.lime, size=size.normal)
plotshape(bearConfirmed, title="Bear TK Cross", style=shape.triangledown,
          location=location.abovebar, color=color.red,  size=size.normal)

// --- Alerts ---
alertcondition(bullConfirmed, title="Bullish TK Cross Confirmed",
               message="Ichimoku: Confirmed bullish TK cross above green Kumo")
alertcondition(bearConfirmed, title="Bearish TK Cross Confirmed",
               message="Ichimoku: Confirmed bearish TK cross below red Kumo")
This script adds Chikou confirmation as a visual reference (the teal line plotted 26 bars back). For the signal markers, it requires the 3-star minimum: TK cross on the correct side of the cloud with matching cloud color. To add Chikou as a hard filter, you'd need to check chikou[displacement] > high[displacement] for bullish setups, which requires accessing historical values with care to avoid lookahead bias.
If you want to extend this into a full Python backtesting environment, the same logic translates directly using pandas and ta-lib or the pandas-ta library. The approach is similar to what's covered in the RSI divergence strategy backtest workflow.
Automating Confluence Scoring With an AI Agent
Ichimoku is fundamentally a confluence system. Its power comes from reading multiple conditions simultaneously, which is tedious for a human watching 10+ instruments but trivial for a reasoning agent.
Here's a concrete example of how you'd configure this in Agentic Traders: describe an agent in plain English as "Watch BTC/USDT on the 4-hour chart. Score each potential trade by how many Ichimoku conditions align: 1 point for TK cross, 1 point for price above cloud, 1 point for green cloud color, 1 point for Chikou clear of price 26 bars back, 1 point for the daily cloud also being bullish. Only enter a long position if the score is 4 or 5. Set stop-loss at the Kijun-sen level and trail it as Kijun rises."
The agent doesn't just execute a rule. It reasons through the current state of each condition, assigns a score, and decides whether the setup meets the threshold. If BTC is at a 3-star setup at 3 AM when you're asleep, the agent passes. If it reaches 5 stars at 6 AM, it enters, sets the stop at Kijun, and logs the reasoning. This is the core difference between a rules-based bot and a reasoning agent — the agent can explain why it did or didn't take a trade, which is something the AI crypto trading bot approaches of earlier years couldn't do.
Common Mistakes That Kill Ichimoku Trades
Trading inside the Kumo. When price is inside the cloud, the market is in equilibrium. Span A and Span B are both nearby, meaning support and resistance are overlapping. TK crosses inside the cloud have a low completion rate because price can chop without committing to either direction. The rule is simple: if price is inside the cloud, the bias is undefined, and directional trades should wait.
Ignoring Chikou span entirely. Most charting tutorials show the Tenkan, Kijun, and cloud but gloss over Chikou. This is the component that tells you whether current price momentum is unobstructed by recent price history. A bullish TK cross above the cloud where Chikou is sitting right under a dense price cluster from 26 periods ago is a much weaker trade than one where Chikou has clear air above it.
Using Ichimoku on timeframes below 1 hour. The 9/26/52 parameters were designed for daily charts. On 5-minute or 15-minute charts, the cloud becomes too thin and the signals too frequent to be meaningful. The indicator works best on 1-hour, 4-hour, and daily charts. For scalping, pair it with a faster momentum indicator rather than trying to make Ichimoku do work it wasn't designed for.
Treating the cloud as a stop-loss zone. The cloud is a support/resistance zone, not a stop-loss level. Placing a stop just below the cloud bottom is a common mistake because the cloud is often wide enough to make the risk/reward ratio unfavorable. The Kijun-sen is a better stop reference — it's a single level, not a zone, and it moves with the trend.
Ignoring the displacement. Span A and Span B are plotted 26 periods into the future. This means the cloud you see ahead of current price is a projection, not a prediction. It tells you where future support/resistance would be if current momentum continues. Traders sometimes read the future cloud as a certainty rather than a conditional projection.
Advanced Configuration: Higher-Timeframe Cloud and Kijun Trailing
The higher-timeframe cloud filter is the single most effective enhancement to standard Ichimoku trading. Before taking any signal on a 4-hour chart, check the daily cloud. If the daily cloud is bullish (price above a green cloud), only take bullish 4-hour signals. If the daily cloud is bearish, only take bearish 4-hour signals. This one filter eliminates a significant portion of counter-trend trades that look valid on the lower timeframe.
Kijun-sen as a trailing stop reference works as follows: once you're in a confirmed bullish trade, move your stop to just below the Kijun-sen after each new candle close. The Kijun is slow-moving and represents the medium-term equilibrium price. As long as price stays above Kijun, the trend structure is intact. When price closes below Kijun, the trend is weakening and the position should be closed or reduced. This is more adaptive than a fixed ATR-based trail because Kijun already incorporates the range of recent price action.
Parameter adjustment for crypto markets. Crypto trades 24/7, which means the "26 trading days = one month" logic doesn't apply the same way. Some practitioners shift to 10 / 30 / 60 for crypto daily charts to approximate the same real-time coverage. Others keep the standard settings on the grounds that market-microstructure effects (the number of participants watching the same levels) make the original parameters self-fulfilling. Test both on your specific instrument before committing.
Combining with volume. Ichimoku is a pure price-action system with no volume component. Adding a volume filter — for example, requiring that the TK cross candle has above-average volume — can improve signal quality, particularly on crypto and forex where volume data quality varies. The Bollinger Band squeeze strategy uses a similar volume-confirmation logic that pairs well with Ichimoku cloud breakouts.
FAQ
Q: Do the standard 9/26/52 settings still work in 2026? Yes. The original settings remain the most widely used, which creates a self-reinforcing effect — the more traders watch the same levels, the more those levels become meaningful. Adjusted settings (7/22/44 for five-day weeks, 10/30/60 for crypto) have theoretical merit, but you lose the network effect of the standard parameters. Start with 9/26/52 and only adjust if you have a specific, backtested reason.
Q: Can Ichimoku be used for forex intraday trading? On 1-hour and 4-hour forex charts, Ichimoku works well. Below 1 hour, the signal frequency increases while quality decreases. The key constraint is that the cloud needs enough price history to form meaningful support/resistance zones, which requires at least 52 periods of clean price data. For forex scalping, use Ichimoku on the 1-hour chart to establish bias and enter on a faster indicator like Stochastic %K/%D crosses in the direction of the cloud.
Q: What's the difference between a bullish TK cross and a Kumo breakout? A TK cross is Tenkan crossing Kijun — a momentum signal. A Kumo breakout is price itself crossing above or below the cloud — a trend signal. Both are valid Ichimoku signals, but they measure different things. The Kumo breakout is generally considered a stronger trend-change signal; the TK cross is a faster, more frequent entry trigger. The strongest setups combine both: a Kumo breakout followed by a TK cross on the new side of the cloud.
Q: How do I handle the Chikou span in a backtesting environment without lookahead bias?
This is a real technical challenge. Chikou is today's close plotted 26 bars back, which means in a live chart it appears at a historical position. In code, when you check close[0] against high[26] (the price 26 bars ago), you're comparing current data to historical data — that's fine. The lookahead problem only arises if you try to check the future cloud (Span A and Span B plotted 26 bars forward) using data that wasn't available at that historical bar. The solution is to always evaluate Chikou using close versus high[displacement] and low[displacement], never accessing future bars.
Q: Is Ichimoku useful for stocks, or is it mainly a forex/crypto tool? Ichimoku works on any liquid market with continuous price data. It was originally developed for Japanese equities. On US stocks, it performs well on daily and weekly charts. The key requirement is sufficient liquidity and continuous trading — thinly traded stocks with large gaps can distort the midpoint calculations. For highly liquid large-cap stocks and ETFs, the daily Ichimoku cloud is a reliable trend-bias filter.
Putting It All Together
Ichimoku is not a "set and forget" indicator. It rewards traders who read all five components, understand the displacement logic, and filter signals by the number of conditions that align. A bare TK cross is noise. A 4-star or 5-star setup — cross on the right side of a correctly colored cloud with Chikou clear and the higher timeframe in agreement — is a genuinely high-probability entry.
The practical workflow is straightforward:
- Check the higher-timeframe (daily or weekly) cloud for directional bias.
- Drop to your trading timeframe (4-hour or 1-hour) and wait for a TK cross in the direction of that bias.
- Confirm price is on the correct side of the cloud and the cloud color matches.
- Check Chikou for obstruction.
- Enter at the close of the TK cross candle with a stop at the Kijun-sen.
- Trail the stop with Kijun as the trend develops.
Each of these steps is a discrete, checkable condition. That's what makes Ichimoku one of the cleanest systems to hand to a reasoning agent — not a vague instruction like "trade with the trend," but a scored checklist that produces a clear go/no-go decision. The artificial intelligence crypto trading guide covers the broader landscape of how agents handle multi-condition strategies like this across asset classes.
Related Articles
- MACD Crossover Strategy: Signals, Backtest & AI Automation
- RSI Divergence Strategy: Spot Reversals and Automate With AI
- Supertrend Strategy: ATR Trend-Following You Can Automate
- Bollinger Band Squeeze: Trading Volatility Breakouts With AI
Test this strategy with an AI agent that scores every Ichimoku condition in real time — start with a $100K paper trading account at Agentic Traders.
Risk-Reward Ratio and Win Rate: The Breakeven Math
Win rate alone never proves a strategy profitable. See how risk-reward ratio and win rate set the breakeven math, with the formula, a lookup table, and code.
Smart Money ConceptsHow to Trade Fair Value Gaps (FVG): Spot and Trade the Fill
A step-by-step guide to fair value gaps: the exact three-candle rule, how to spot FVGs, entry and stop placement on the fill, plus Pine Script v6 code.
AI AgentsWhat Is Agentic Trading? How AI Agents Trade the Markets
Agentic trading is when an AI agent reasons through live market data and calls indicators as tools to trade on its own. Here's how it works, and its limits.
IndicatorsBollinger Band Squeeze: Trading Volatility Breakouts With AI
Learn to detect Bollinger Band squeezes, trade breakout and reversion playbooks, and automate with an AI agent that confirms expansion before acting.
Run this strategy with an AI Trader.
Tell the AI your strategy. It picks the indicators, reasons through every setup, and trades for you 24/7. Free to start. No code.
Build your AI Trader — free