Bollinger Band Squeeze: Trading Volatility Breakouts With AI
Learn to detect Bollinger Band squeezes, trade breakout and reversion playbooks, and automate with an AI agent that confirms expansion before acting.
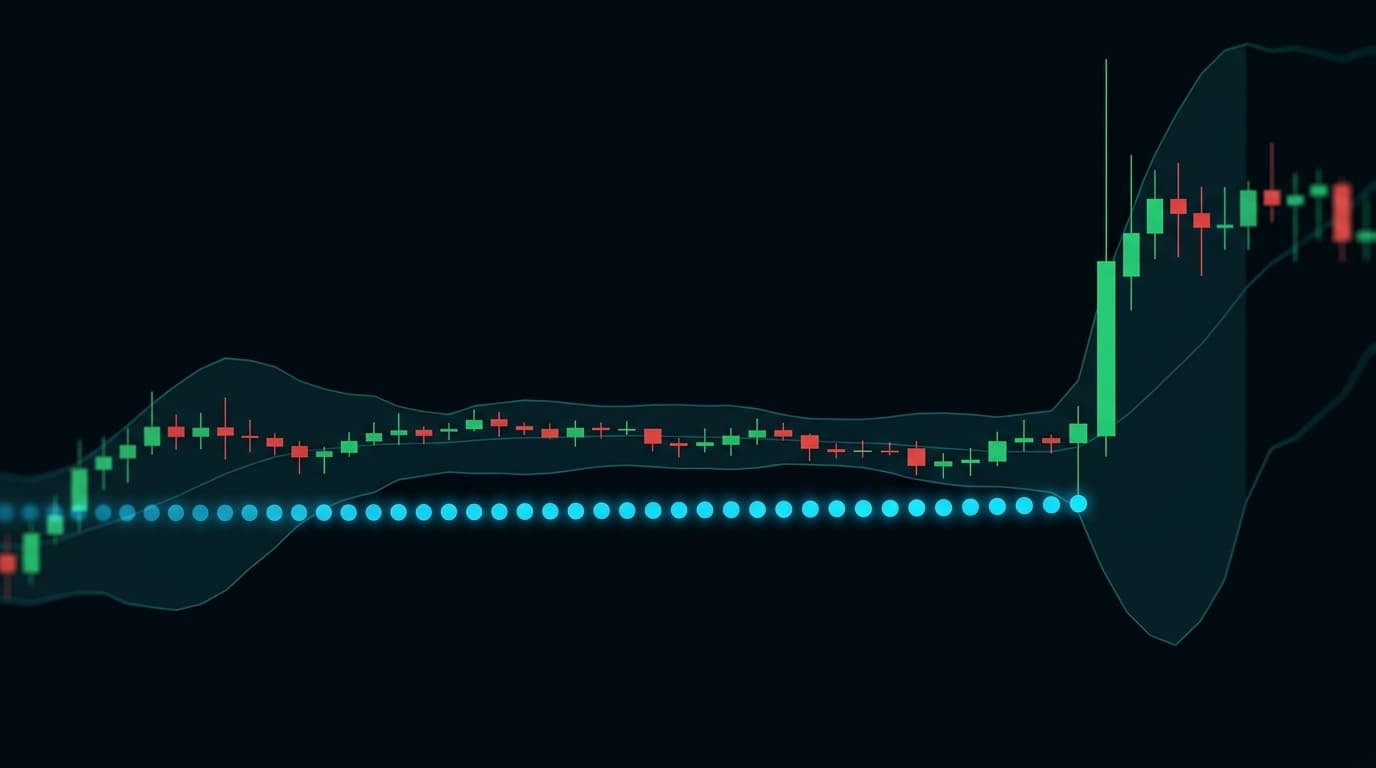
A market that isn't moving is about to move. That sounds obvious until you realize most traders are watching the wrong signal. They wait for price to break a level, then chase. The Bollinger Band squeeze forces you to watch before the move, when volatility is compressing like a spring — and it gives you a precise, measurable threshold to know when the spring releases.
The problem is that the squeeze tells you when, not which direction. That asymmetry is exactly where most traders blow up the setup. This article covers how the squeeze works mechanically, the two playbooks for trading it, a copy-paste Pine Script detector, and how an AI agent can handle the directional judgment that a pure indicator cannot.
What you'll learn:
- How bandwidth contraction is measured and why it predicts expansion
- The squeeze-inside-Keltner-Channels visualization and why it matters
- Two distinct playbooks: breakout trading vs mean reversion at the bands
- A working Pine Script v6 squeeze detector with alerts
- Band parameter settings by timeframe and asset class
- How to configure an AI reasoning agent to wait for confirmed expansion plus volume before committing to a side
The Mechanics of a Squeeze: Bandwidth, Not Just the Bands
Bollinger Bands consist of a 20-period simple moving average with an upper and lower band set 2 standard deviations above and below it. The standard deviation calculation makes the bands self-adjusting: they widen when price swings are large and contract when price action quiets down.
Bandwidth is the metric that makes the squeeze tradeable. The formula is straightforward:
Bandwidth = (Upper Band - Lower Band) / Middle Band
When bandwidth falls to a multi-month low, volatility is compressed relative to recent history. John Bollinger, who developed the indicator, described this condition as "the Squeeze" — a period of low volatility that typically precedes a significant directional move. The historical tendency is well-documented: prolonged low-volatility periods are followed by high-volatility expansions, a pattern consistent with volatility clustering observed in financial time series research.
The Keltner Channel overlay adds a second layer of precision. Keltner Channels use a 20-period EMA as the midline with bands set at 1.5× ATR above and below. When Bollinger Bands are entirely inside Keltner Channels — meaning the BB upper is below the KC upper and the BB lower is above the KC lower — the squeeze is confirmed. This is the TTM Squeeze concept popularized by John Carter, and it filters out minor bandwidth contractions that don't represent true volatility compression.
Breakout Playbook vs Mean-Reversion Playbook
These two approaches use the same indicator but operate on different market assumptions. Confusing them is one of the most common mistakes in squeeze trading.
The Breakout Playbook
The breakout approach treats the squeeze as a coiled spring. You wait for the squeeze to release — bandwidth starts expanding, price closes outside the bands — and you trade in the direction of the initial expansion. The logic is that the compressed energy has to go somewhere, and the first strong directional candle after the release often defines the move.
Entry timing matters here. The first candle that closes outside the band after a confirmed squeeze is the trigger. You are not entering during the squeeze; you are entering on the first evidence of expansion. Stop placement goes at the opposite band or at the midline, depending on your risk tolerance. A 1.5× ATR stop from entry is a common alternative that keeps the stop proportional to the current volatility environment.
The Mean-Reversion Playbook
Mean reversion at the bands works in a different context: a ranging market where price has been oscillating between defined levels. When price touches the upper band in a low-bandwidth environment without a confirmed squeeze release, it often snaps back toward the midline. The same logic applies at the lower band.
This playbook fails badly when applied to a squeeze release. If the bands are expanding and price is closing outside them on volume, that is not a mean-reversion setup — it is a breakout setup misidentified. The distinction between a "touch during consolidation" and a "touch during expansion" is the entire difference between a high-probability reversion trade and a trade that will stop you out repeatedly.
The RSI Divergence Strategy pairs well with the mean-reversion playbook: when RSI shows bearish divergence at the upper band in a ranging market, the probability of reversion increases substantially.
Pine Script v6 Squeeze Detector
The code below plots bandwidth as a histogram, marks squeeze on/off states with colored dots, and fires an alert when the squeeze releases. It uses the Keltner Channel confirmation method.
//@version=6
indicator("BB Squeeze Detector", overlay=false, shorttitle="BBSqueeze")

// --- Inputs ---
bb_length  = input.int(20,    "BB Length",       minval=1)
bb_mult    = input.float(2.0, "BB StdDev Mult",  step=0.1)
kc_length  = input.int(20,    "KC Length",       minval=1)
kc_mult    = input.float(1.5, "KC ATR Mult",     step=0.1)

// --- Bollinger Bands ---
bb_basis   = ta.sma(close, bb_length)
bb_dev     = bb_mult * ta.stdev(close, bb_length)
bb_upper   = bb_basis + bb_dev
bb_lower   = bb_basis - bb_dev

// --- Keltner Channels ---
kc_basis   = ta.ema(close, kc_length)
kc_range   = kc_mult * ta.atr(kc_length)
kc_upper   = kc_basis + kc_range
kc_lower   = kc_basis - kc_range

// --- Squeeze Logic ---
squeeze_on  = (bb_upper < kc_upper) and (bb_lower > kc_lower)
squeeze_off = not squeeze_on

// --- Bandwidth ---
bandwidth  = (bb_upper - bb_lower) / bb_basis * 100

// --- Squeeze Release: first bar squeeze transitions from on to off ---
squeeze_release = squeeze_off and squeeze_on[1]

// --- Plots ---
hline(0, "Zero", color=color.gray, linestyle=hline.style_dotted)

plot(bandwidth, title="Bandwidth %", color=color.new(color.aqua, 0), linewidth=2)

plotshape(squeeze_on,      title="Squeeze ON",      location=location.bottom,
          style=shape.circle, color=color.red,   size=size.tiny)
plotshape(squeeze_release, title="Squeeze Release", location=location.bottom,
          style=shape.circle, color=color.lime,  size=size.small)

// --- Alert ---
alertcondition(squeeze_release, title="Squeeze Released",
               message="BB Squeeze released on {{ticker}} {{interval}} — confirm direction before entry.")
To use this on TradingView, open the Pine Script editor, paste the code, and add it to your chart. The red dots indicate an active squeeze; a green dot marks the first bar of the release. The alert fires on the green dot — not mid-squeeze — so you are reacting to confirmed expansion, not anticipating it.
For a deeper look at pairing momentum oscillators with breakout confirmation, the MACD Crossover Strategy article covers how MACD histogram direction on the release bar can help confirm which side the breakout is favoring.
Band Settings by Timeframe and Asset Class
The default 20/2 settings work well for equities on daily charts, where Bollinger originally calibrated them. Other timeframes and asset classes require adjustment. The table below reflects common practitioner configurations as of 2026.
| Asset Class | Timeframe | BB Length | BB Multiplier | KC Multiplier | Notes |
|---|---|---|---|---|---|
| Equities (large cap) | Daily | 20 | 2.0 | 1.5 | Original Bollinger defaults |
| Equities (large cap) | 4H | 20 | 2.0 | 1.5 | Works without adjustment |
| Crypto (BTC/ETH) | 4H | 20 | 2.0 | 1.5 | Standard; watch for weekend gaps |
| Crypto (altcoins) | 1H | 14 | 1.5 | 1.2 | Shorter length for faster cycles |
| Forex majors | 4H | 20 | 2.0 | 1.5 | Standard settings apply |
| Forex majors | 1H | 14 | 1.8 | 1.4 | Reduce multiplier for tighter pairs |
| Commodities (crude, gold) | Daily | 20 | 2.0 | 1.5 | Gap risk on futures rollover |
| Futures (ES, NQ) | 15min | 20 | 1.5 | 1.2 | Intraday; lower multipliers reduce noise |
The key principle: shorter lookback periods and lower multipliers for faster, noisier markets (crypto altcoins, intraday futures). Longer lookbacks and standard multipliers for slower, cleaner markets (daily equities, forex majors). If you are seeing squeeze signals fire every few bars, the multiplier is too tight for the asset's natural volatility.
Why the Squeeze Doesn't Tell You Direction — And What Does
This is the part most articles skip. The squeeze is a timing indicator, not a directional indicator. Bandwidth contracting to a 6-month low tells you that a significant move is coming. It tells you nothing about whether that move will be up or down.
Traders who treat the squeeze as a directional signal end up doing one of two things: picking a direction based on gut feel and calling it "reading the tape," or entering both sides simultaneously in some kind of straddle that only makes sense in options. Neither is a systematic edge.
The directional filters that actually work in combination with squeeze releases:
- Price structure relative to the midline. If price is above the 20 SMA at the moment of release, the bias is long. Below it, short. This is not a guarantee, but it is statistically consistent.
- Volume on the release bar. A squeeze release candle with volume 1.5× or more above the 20-bar average volume is significantly more likely to follow through than a release on thin volume. This is the single most reliable filter.
- Higher-timeframe trend alignment. A squeeze release on the 1-hour chart that aligns with the 4-hour trend direction has a higher follow-through rate than a counter-trend release.
- Momentum confirmation. MACD histogram crossing zero on the release bar, or RSI moving from below 50 to above 50 (or vice versa), adds directional conviction.
- False-breakout filter. If price closes back inside the bands within two bars of the release, the breakout has failed. Exit immediately and wait for the next setup.
The Supertrend Strategy article covers higher-timeframe trend alignment in detail — specifically how ATR-based trend filters reduce counter-trend false breakouts, which is directly applicable to squeeze release confirmation.
Common Mistakes in Squeeze Trading
1. Front-running the squeeze release
Entering while the squeeze is still active — before bandwidth has started expanding — is the most common error. The squeeze can persist for weeks. Entering early means sitting through the full compression period with capital at risk and no directional signal. Wait for the green dot.
2. Fading the bands during a squeeze release
When a squeeze releases to the upside and price closes above the upper band, the mean-reversion instinct kicks in. "Price is extended, it must come back." In a genuine breakout, price can close outside the bands for 5–10 consecutive bars. Fading the band in this context will stop you out repeatedly. The bands are expanding — they are not a ceiling.
3. Using the same settings across all assets and timeframes
The 20/2 default is calibrated for daily equity charts. Applying it to a 5-minute crypto chart without adjustment produces either constant squeeze signals (multiplier too wide) or no signals at all (multiplier too tight). Calibrate per the table above.
4. Ignoring volume entirely
A squeeze release on declining volume is a warning sign, not a trade. Volume is the fuel for breakout follow-through. Many traders set the squeeze detector and never add a volume condition. The result is a 40–50% win rate on breakout trades instead of the 60–65% achievable with volume confirmation.
5. Treating every squeeze identically
A 3-bar squeeze and a 30-bar squeeze are not the same setup. Longer squeezes represent more compressed energy and tend to produce more powerful releases. Tracking the length of the squeeze (number of consecutive bars with squeeze on) and weighting position size accordingly is a refinement most retail traders never implement.
Pro Tips: Non-Obvious Parameter Choices
Use 1.0× KC multiplier for the strictest squeeze definition. The standard 1.5× catches most squeezes, but reducing the KC multiplier to 1.0× filters to only the tightest compressions. These fire less often but have historically higher follow-through rates on daily equity charts. Fewer signals, higher quality.
Track the bandwidth percentile, not the raw bandwidth level. A bandwidth of 3% on a crypto asset might be a 6-month low. The same 3% on a forex major might be average. Normalize bandwidth by calculating its percentile rank over a 252-bar lookback (one trading year for equities). Squeezes in the bottom 10th percentile of bandwidth are the setups worth prioritizing.
Add a momentum histogram to your squeeze chart. The original TTM Squeeze indicator by John Carter includes a momentum histogram derived from a linear regression of price. When the histogram is rising and positive at the squeeze release, the long breakout has confirmation. When it is falling and negative, the short breakout has confirmation. This is available in TradingView's built-in TTM Squeeze indicator if you want a reference implementation.
For crypto, check funding rates during a squeeze. On perpetual futures, a squeeze with elevated positive funding rates means longs are paying shorts — the market is already leaning one way. A squeeze release to the downside in this environment can be particularly sharp because longs are forced to unwind. This is a 2026-era edge that didn't exist in traditional markets.
Multi-timeframe squeeze stacking. When the daily, 4H, and 1H charts are all simultaneously in a squeeze, the eventual release tends to be explosive. This is rare — maybe 3–4 times per year on any given asset — but the setups are worth waiting for.
How an AI Agent Handles the Directional Judgment
The squeeze is a textbook example of a setup that is easy to detect mechanically but hard to trade systematically, because the directional decision requires synthesizing multiple signals at once. This is exactly where a reasoning agent outperforms a simple rules-based bot.
In Agentic Traders, you could describe the following agent in plain English:
"Watch BTC/USDT on the 4-hour chart. When the Bollinger Band squeeze releases — meaning bandwidth starts expanding after at least 8 consecutive bars of squeeze-on — check three things before entering: (1) is volume on the release bar at least 1.5× the 20-bar average? (2) is price above the 20 SMA for a long, or below it for a short? (3) does the 4-hour MACD histogram confirm the direction? If all three conditions are met, enter in the confirmed direction with a stop at 1.5× ATR from entry and a target of 3× ATR. If the price closes back inside the bands within two bars, exit immediately regardless of P&L."
The agent reasons through each condition sequentially, calls the relevant indicator tools (Bollinger Bands, ATR, MACD, volume), and only acts when the full checklist passes. It doesn't guess the breakout direction during the squeeze — it waits for confirmation. This is the behavior that separates a reasoning agent from a simple alert-and-execute bot. The agent can also adapt: if the 4H trend contradicts the 1H release direction, it can flag the conflict and hold rather than forcing a trade. If you're exploring how AI agents handle multi-condition strategy logic across crypto markets, the Artificial Intelligence Crypto Trading guide covers the broader architecture.
FAQ
Q: How long does a typical Bollinger Band squeeze last?
Squeeze duration varies widely by asset and timeframe. On daily equity charts, squeezes commonly last 10–30 bars. On 4-hour crypto charts, they can resolve in 5–8 bars or persist for 20+. The longer the squeeze, the more significant the eventual release tends to be. There is no fixed duration that signals "the squeeze is about to release" — you watch for bandwidth to start expanding, not for a specific time count.
Q: Can the squeeze be used on all asset classes?
Yes, but parameter adjustment is required. Crypto assets are more volatile than equities, which means bandwidth naturally runs higher — the standard 2.0 multiplier may rarely produce squeeze signals. Reducing the KC multiplier to 1.2–1.3 brings the signal frequency in line with what you'd see on equity daily charts. Forex pairs with very tight spreads and low volatility (EUR/CHF, for example) may need the opposite adjustment.
Q: What's the difference between a squeeze release and a false breakout?
A genuine squeeze release shows price closing outside the bands on above-average volume, with the bands visibly expanding. A false breakout shows price closing outside the bands briefly, then closing back inside within 1–2 bars, often on declining volume. The two-bar close-back rule is the cleanest filter: if price returns inside the bands within two bars, treat the breakout as failed and step aside.
Q: Should I trade the squeeze on earnings or news events?
Earnings announcements and major macro events (FOMC, CPI) naturally create squeezes in the days leading up to the event. These are mechanically identical to organic squeezes but carry gap risk — the release can happen overnight with no entry opportunity. Many traders avoid holding through scheduled events even when a squeeze is active, preferring to re-enter after the gap settles.
Q: How do I combine the squeeze with the mean-reversion playbook?
The mean-reversion playbook applies outside of active squeezes, in ranging markets with stable bandwidth. When bandwidth is at or above its 6-month average, price touching the upper or lower band often reverts to the midline. When bandwidth is at a 6-month low (squeeze active), do not fade the bands — wait for the release and trade the breakout. The two playbooks operate in mutually exclusive market conditions.
Putting It All Together
The Bollinger Band squeeze is one of the cleanest volatility setups in technical analysis because it is objective and measurable. Bandwidth either is or isn't at a multi-period low. The Keltner Channel confirmation either is or isn't active. There is no subjectivity in detecting the setup.
The subjectivity enters at the directional decision — and that is where most retail traders either guess or abandon the setup entirely. The systematic answer is to treat the squeeze as the entry condition and use volume, price structure, and momentum confirmation as the directional filter. All three need to agree before you act.
The Pine Script detector above gives you the mechanical detection. The parameter table gives you calibrated settings for your specific market. The five-condition directional checklist gives you a systematic way to filter the direction. What remains is execution discipline: waiting for the green dot, checking the filters, and not entering during the squeeze itself regardless of how obvious the direction looks.
Volatility compression is patient. You should be too.
Related Articles
- RSI Divergence Strategy: Spot Reversals and Automate With AI
- MACD Crossover Strategy: Signals, Backtest & AI Automation
- Supertrend Strategy: ATR Trend-Following You Can Automate
Try the Bollinger Band squeeze strategy with an AI agent that handles all five directional filters automatically — start with a $100K paper trading account at Agentic Traders.
Risk-Reward Ratio and Win Rate: The Breakeven Math
Win rate alone never proves a strategy profitable. See how risk-reward ratio and win rate set the breakeven math, with the formula, a lookup table, and code.
Smart Money ConceptsHow to Trade Fair Value Gaps (FVG): Spot and Trade the Fill
A step-by-step guide to fair value gaps: the exact three-candle rule, how to spot FVGs, entry and stop placement on the fill, plus Pine Script v6 code.
AI AgentsWhat Is Agentic Trading? How AI Agents Trade the Markets
Agentic trading is when an AI agent reasons through live market data and calls indicators as tools to trade on its own. Here's how it works, and its limits.
StrategiesIchimoku Cloud Strategy: Reading the Kumo and Automating Entries
Master all five Ichimoku lines, trade cloud bias and TK crosses, and use an AI agent that scores confluence before entering.
Run this strategy with an AI Trader.
Tell the AI your strategy. It picks the indicators, reasons through every setup, and trades for you 24/7. Free to start. No code.
Build your AI Trader — free