Option Trading for Beginners: The Complete 2026 Guide (PDF Alternative)
Learn option trading from scratch with real examples, code, and strategy setups. Better than any PDF—actionable, updated for 2026, with automated execution tips.
You open a PDF titled "Options Trading for Dummies" and flip to page 47. The example uses a stock that delisted in 2019. The Greeks section explains delta without showing you how to read it on a real options chain. The strategy chapter says "sell covered calls for income" but never specifies strike selection or expiration windows.
Most option trading PDFs were written once and never updated. Markets evolved. Platforms changed. The retail options landscape in 2026—with zero-commission trades, fractional contracts on some brokers, and AI agents that can monitor Greeks in real time—looks nothing like the world those PDFs described.
This guide replaces the PDF. You'll get the foundational concepts, real code to calculate payoffs and Greeks, comparison tables for strategy selection, and concrete examples you can test today. No fluff. No outdated screenshots. Just the mechanics, the math, and the execution details you need to place your first option trade with confidence.
What you'll learn
- How call and put options work, with exact payoff formulas and breakeven calculations
- The four basic option positions and when to use each one
- How to read an options chain and decode bid-ask spreads, implied volatility, and open interest
- Greeks explained with real numbers: delta, gamma, theta, vega
- Three beginner-friendly strategies with entry rules, risk parameters, and profit targets
- How to calculate position size and maximum loss before entering any trade
- Python code to model option payoffs and compare strategies
- Common beginner mistakes that blow up accounts, with specific fixes
How options contracts actually work
An option gives you the right—not the obligation—to buy or sell 100 shares of an underlying asset at a specific price (the strike) before a specific date (expiration). You pay a premium upfront for this right. If the option expires worthless, you lose the premium. If it moves in your favor, you can sell it for a profit or exercise it to buy/sell the shares.
Two types exist: calls and puts.
A call option gives you the right to buy shares at the strike price. You profit when the underlying price rises above the strike plus the premium you paid.
A put option gives you the right to sell shares at the strike price. You profit when the underlying price falls below the strike minus the premium you paid.
One contract controls 100 shares. If you buy a call option for $2.50 per share, you pay $250 total ($2.50 × 100). If the stock rises and the option is worth $5.00 at expiration, you sell for $500. Your profit: $500 − $250 = $250, or 100% return on the premium.
Options expire. Most retail traders use weekly or monthly expirations. The closer to expiration, the faster time decay erodes the option's value. This decay accelerates in the final two weeks.
Intrinsic value vs extrinsic value
Every option premium splits into two components:
Intrinsic value = how much the option is in-the-money right now. For a call, it's max(0, stock price − strike price). For a put, it's max(0, strike price − stock price).
Extrinsic value = the rest of the premium. This is time value plus volatility premium. It decays to zero by expiration.
Example: Stock trades at $105. You own a $100 call priced at $7.50. Intrinsic value = $105 − $100 = $5.00. Extrinsic value = $7.50 − $5.00 = $2.50. If the stock stays at $105 until expiration, the option will be worth exactly $5.00. The $2.50 extrinsic decays away.
The four basic positions every trader must understand
Options create four fundamental positions. Everything else—spreads, straddles, iron condors—is a combination of these four.
| Position | Direction | Max Profit | Max Loss | Breakeven |
|---|---|---|---|---|
| Long Call | Bullish | Unlimited | Premium paid | Strike + premium |
| Long Put | Bearish | Strike − premium | Premium paid | Strike − premium |
| Short Call | Bearish/Neutral | Premium received | Unlimited | Strike + premium |
| Short Put | Bullish/Neutral | Premium received | Strike − premium | Strike − premium |
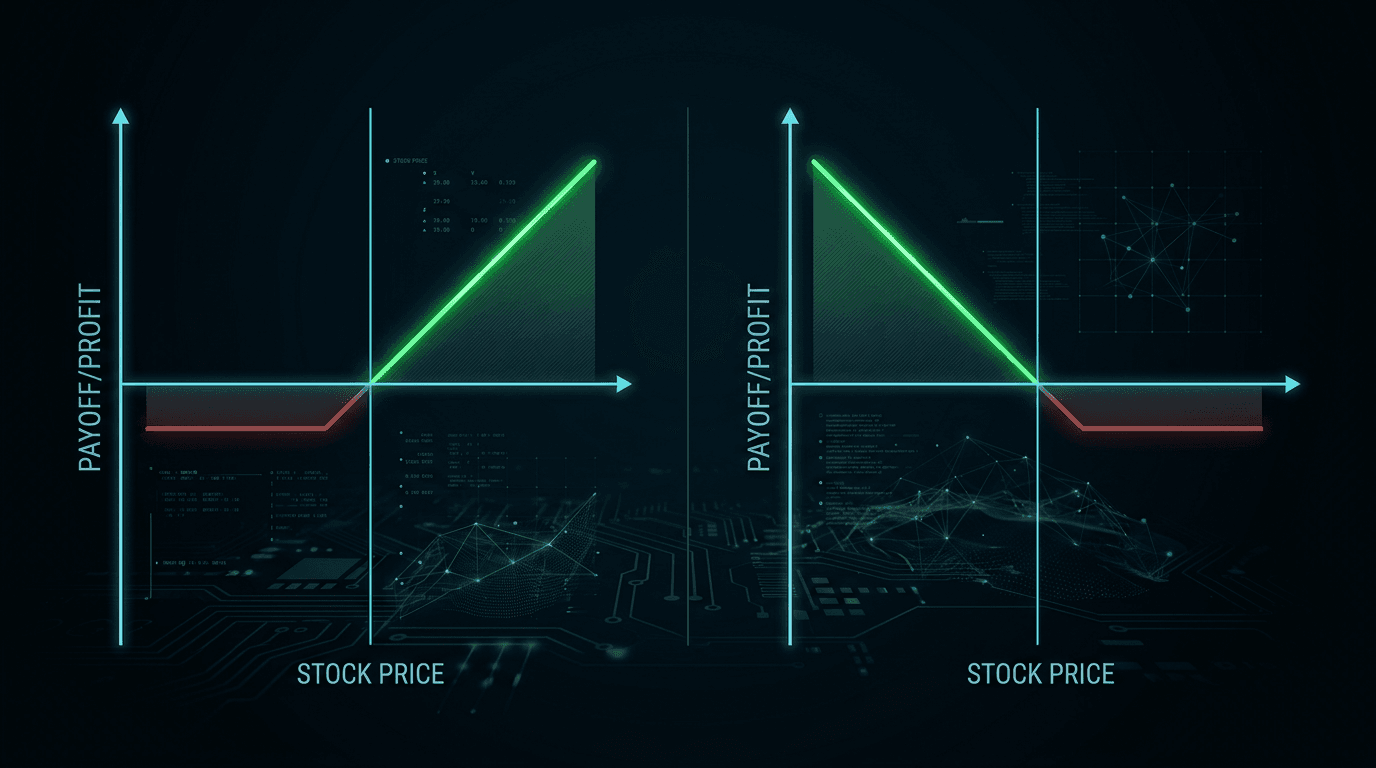
Long call: You buy a call. You want the stock to rise. Maximum loss is the premium you paid. Maximum profit is unlimited as the stock climbs. Breakeven = strike + premium.
Long put: You buy a put. You want the stock to fall. Maximum loss is the premium. Maximum profit is the strike price minus the premium (since the stock can only fall to zero). Breakeven = strike − premium.
Short call: You sell a call. You collect premium upfront. You want the stock to stay flat or fall. If the stock rises above the strike, you face unlimited losses because you must deliver shares at the strike while the market price climbs. Most retail traders sell covered calls (own the shares) to cap this risk.
Short put: You sell a put. You collect premium upfront. You want the stock to stay flat or rise. If the stock crashes below the strike, you must buy shares at the strike even though they're worth less. Maximum loss = strike price − premium received.
Beginners should start with long calls and long puts. Defined risk. No margin requirements. You can't lose more than you paid. Short options require margin approval and carry undefined risk unless paired with a long option (creating a spread).
Reading an options chain without getting lost
An options chain lists all available strikes and expirations for an underlying. Every broker displays it differently, but the core columns are the same:
- Strike: the price at which the option can be exercised
- Bid: the highest price a buyer is willing to pay right now
- Ask: the lowest price a seller will accept right now
- Last: the price of the most recent trade (often stale if volume is low)
- Volume: contracts traded today
- Open Interest: total contracts outstanding (not yet closed or exercised)
- Implied Volatility (IV): the market's expectation of future volatility, expressed as an annualized percentage
The bid-ask spread is your transaction cost. If the bid is $2.40 and the ask is $2.60, you pay $2.60 to buy and receive $2.40 to sell. On low-volume options, spreads widen to $0.50 or more. Avoid those. Stick to options with volume > 100 and open interest > 500.
Implied volatility tells you if options are expensive or cheap relative to historical norms. High IV = expensive premiums. Low IV = cheap premiums. If you're buying options, you want low IV. If you're selling options, you want high IV. Compare the current IV to the underlying's 30-day historical volatility (HV). If IV > HV, options are priced rich. If IV < HV, they're priced cheap.
Open interest indicates liquidity. High open interest (thousands of contracts) means you can enter and exit without slippage. Low open interest (single digits) means the market maker controls the price and you'll pay wide spreads.
When selecting a strike, consider the delta. Delta approximates the probability the option expires in-the-money. A call with delta 0.30 has roughly a 30% chance of expiring above the strike. Deltas closer to 0.50 are near-the-money. Deltas above 0.70 are deep in-the-money. Beginners often buy out-of-the-money options (delta < 0.30) because they're cheap, then watch them expire worthless. Start with deltas between 0.40 and 0.60.
Greeks decoded: the five numbers that control your P&L
Options prices don't move in straight lines with the stock. The Greeks measure sensitivity to different variables. You don't need to memorize formulas, but you must understand how each Greek affects your position.
Delta
Delta measures how much the option price changes when the underlying moves $1. A call with delta 0.50 gains $0.50 per share ($50 per contract) when the stock rises $1. A put with delta −0.30 gains $0.30 per share when the stock falls $1 (negative because puts profit from declines).
Delta also approximates the probability of expiring in-the-money. A 0.70 delta call has roughly a 70% chance of finishing above the strike.
Delta changes as the stock moves. This rate of change is gamma.
Gamma
Gamma measures how much delta changes when the underlying moves $1. High gamma means delta accelerates quickly. At-the-money options have the highest gamma. Deep in-the-money and far out-of-the-money options have low gamma.
Long options have positive gamma. As the stock moves in your favor, delta increases, amplifying gains. As it moves against you, delta decreases, slowing losses.
Short options have negative gamma. As the stock moves against you, delta increases, accelerating losses. This is why short option positions can blow up fast.
Theta
Theta measures time decay: how much value the option loses per day, all else equal. Theta is always negative for long options and positive for short options.
An option with theta −0.05 loses $0.05 per share ($5 per contract) per day. Theta accelerates as expiration approaches. Options expiring in 7 days decay faster than options expiring in 60 days.
If you buy an option and the stock doesn't move, theta bleeds your premium. If you sell an option and the stock doesn't move, theta pays you every day.
Vega
Vega measures sensitivity to implied volatility. An option with vega 0.15 gains $0.15 per share for every 1% increase in IV.
Long options have positive vega. You profit when IV rises (volatility expansion). Short options have negative vega. You profit when IV falls (volatility contraction).
If you buy options before earnings and IV spikes, vega can double your premium even if the stock barely moves. If you buy options after earnings and IV collapses, vega can cut your premium in half overnight (IV crush).
Rho
Rho measures sensitivity to interest rate changes. For most retail option trades, rho is negligible. It matters for long-dated options (LEAPS) and when the Fed makes large rate moves. You can ignore rho until you're trading options with 6+ months to expiration.
Three beginner strategies with exact entry and exit rules
Start with these three setups. Each has defined risk, clear entry signals, and straightforward management.
Strategy 1: Long call on a breakout
Setup: Stock breaks above a key resistance level on high volume. You buy an at-the-money or slightly out-of-the-money call expiring 30–45 days out.
Entry rules:
- Stock closes above resistance with volume 1.5× the 20-day average
- Select a call with delta between 0.40 and 0.60
- Implied volatility below the 30-day average (don't overpay)
- Risk no more than 2% of account on the premium
Exit rules:
- Profit target: sell at 50% gain (option doubles from $2.00 to $3.00)
- Stop loss: sell if option loses 50% of value (drops from $2.00 to $1.00)
- Time stop: close position at 7 days to expiration to avoid terminal theta decay
Example: Stock breaks above $50 resistance on February 3, 2026. You buy the March 7 $52.50 call for $2.10 (delta 0.48). Stock rallies to $55 by February 20. Option is now worth $4.20. You sell for a $210 profit per contract.
Strategy 2: Cash-secured put on a pullback
Setup: Stock you want to own pulls back to support. You sell a put at or below that support level, collecting premium. If assigned, you buy shares at the strike (which you wanted anyway). If the stock bounces, the put expires worthless and you keep the premium.
Entry rules:
- Stock pulls back to a defined support level (prior low, moving average, Fibonacci retracement)
- Sell a put at or below support, expiring 14–30 days out
- Delta between −0.30 and −0.40 (70–60% probability of expiring worthless)
- Premium collected ≥ 1% of the strike price
Exit rules:
- Profit target: buy back the put at 50% of the premium collected (sold for $1.50, buy back at $0.75)
- Assignment: accept assignment and own the shares at the strike
- Roll: if the stock drops below the strike before expiration and you still want to own it, roll the put to a later expiration at the same strike
Example: Stock pulls back from $80 to $75, a prior support level. You sell the $75 put expiring in 21 days for $1.80 (delta −0.35). Stock bounces to $78. Put decays to $0.60. You buy it back for a $120 profit per contract. If the stock had dropped to $72, you'd be assigned 100 shares at $75, which is $3 above the market but $1.80 below your effective cost basis ($75 − $1.80 = $73.20).
Strategy 3: Covered call on a flat stock
Setup: You own 100 shares of a stock. It's been range-bound for weeks. You sell an out-of-the-money call against your shares, collecting premium. If the stock stays flat or falls, the call expires worthless and you keep the premium. If the stock rallies above the strike, your shares are called away at the strike (you cap your upside but still profit).
Entry rules:
- Own 100 shares (or multiples of 100)
- Stock has been in a range for at least 4 weeks
- Sell a call 5–10% above the current price, expiring 30–45 days out
- Delta between 0.20 and 0.30 (70–80% probability of expiring worthless)
Exit rules:
- Profit target: buy back the call at 50% of the premium collected
- Assignment: let shares be called away at the strike if the stock rallies
- Roll: if the stock approaches the strike and you don't want to sell, roll the call to a higher strike or later expiration
Example: You own 100 shares of a stock trading at $60. It's been stuck between $58 and $62 for six weeks. You sell the $65 call expiring in 35 days for $1.20 (delta 0.25). Stock stays at $61 through expiration. Call expires worthless. You keep the $120 premium. Annualized, that's a 7.3% yield on your shares. For more advanced covered call setups, see our guide to the best covered calls stocks for high-premium opportunities.
Calculating position size and maximum loss before entry
Never enter an option trade without calculating your maximum loss. For long options, max loss = premium paid × 100 × number of contracts. For short options, max loss depends on the position.
Position sizing formula: risk no more than 1–2% of your account on any single trade.
Example: $10,000 account. 2% risk = $200. You want to buy a call for $2.50 per share ($250 per contract). You can buy 0.8 contracts, which rounds to zero. You either reduce risk to 1.5% ($150, still not enough) or increase your account size. This is why small accounts struggle with options: you can't scale down below one contract.
Alternative: use a smaller underlying. Instead of trading options on a $500 stock, trade options on a $50 stock. Premiums will be proportionally smaller.
Maximum loss scenarios:
- Long call or put: premium paid × 100
- Short call (naked): unlimited (stock can rise infinitely)
- Short put (cash-secured): (strike price − premium) × 100
- Covered call: (purchase price − strike price) × 100, plus you lose the shares
- Vertical spread: (width of strikes − premium collected) × 100
Before entering any trade, write down:
- Maximum loss in dollars
- Breakeven price
- Profit target price
- Exit plan if the trade moves against you
If you can't calculate these in 30 seconds, don't place the trade.
Python code to model option payoffs and compare strategies
You don't need to guess how an option will perform at expiration. Model it. Here's Python code to calculate payoff for a long call and a long put, then plot the results.
import numpy as np
import matplotlib.pyplot as plt

def long_call_payoff(stock_prices, strike, premium):
    """Calculate payoff for a long call at expiration."""
    intrinsic = np.maximum(stock_prices - strike, 0)
    return intrinsic - premium

def long_put_payoff(stock_prices, strike, premium):
    """Calculate payoff for a long put at expiration."""
    intrinsic = np.maximum(strike - stock_prices, 0)
    return intrinsic - premium

# Parameters
current_price = 100
call_strike = 105
call_premium = 3.50
put_strike = 95
put_premium = 3.00

# Generate stock price range
stock_prices = np.linspace(80, 120, 200)

# Calculate payoffs
call_payoff = long_call_payoff(stock_prices, call_strike, call_premium)
put_payoff = long_put_payoff(stock_prices, put_strike, put_premium)

# Plot
plt.figure(figsize=(12, 6))
plt.plot(stock_prices, call_payoff, label=f'Long Call (Strike ${call_strike}, Premium ${call_premium})', linewidth=2)
plt.plot(stock_prices, put_payoff, label=f'Long Put (Strike ${put_strike}, Premium ${put_premium})', linewidth=2)
plt.axhline(0, color='black', linestyle='--', linewidth=0.8)
plt.axvline(current_price, color='gray', linestyle='--', linewidth=0.8, label=f'Current Price ${current_price}')
plt.xlabel('Stock Price at Expiration')
plt.ylabel('Profit / Loss ($)')
plt.title('Long Call vs Long Put Payoff Diagrams')
plt.legend()
plt.grid(alpha=0.3)
plt.show()

# Breakeven calculations
call_breakeven = call_strike + call_premium
put_breakeven = put_strike - put_premium
print(f"Long Call Breakeven: ${call_breakeven:.2f}")
print(f"Long Put Breakeven: ${put_breakeven:.2f}")
Run this code to visualize how each position profits at different stock prices. Modify the strike and premium variables to test different setups. Add more strategies by defining new payoff functions (e.g., short call, vertical spread).
For traders using AI agents to automate entries, you can configure an agent in Agentic Traders to monitor delta and IV on specific strikes, then execute a long call when IV drops below the 20th percentile and delta crosses above 0.45, ensuring you buy options when they're cheap and have a reasonable probability of profit.
Common mistakes that blow up beginner accounts
Mistake 1: Buying cheap out-of-the-money options
You see a $0.50 call on a $100 stock with a $110 strike expiring in 7 days. It's cheap. If the stock jumps to $115, you'll 10× your money. So you buy 10 contracts for $500.
The stock closes at $108 on expiration. Your options expire worthless. You lose $500.
Why it fails: Low-delta options (< 0.20) have a small probability of expiring in-the-money. The low price reflects this low probability. You're not getting a bargain; you're buying a lottery ticket.
Fix: Buy options with delta between 0.40 and 0.60. Yes, they cost more. But they have a realistic chance of profit.
Mistake 2: Holding through expiration week
You bought a call for $3.00. It's now worth $4.50 with 5 days to expiration. You hold, hoping it goes to $6.00. The stock moves sideways. Theta decay accelerates. By expiration, the option is worth $2.50. You turned a winner into a loser.
Why it fails: Theta decay accelerates in the final two weeks, especially the last 7 days. Holding through expiration week means you're fighting time decay every single day.
Fix: Close profitable trades at 7 days to expiration. Take the gain. Redeploy capital into a new setup.
Mistake 3: Ignoring implied volatility
You buy a call before earnings. IV is at the 90th percentile. The stock beats earnings and rises 5%. Your call loses money because IV collapses 40% overnight (IV crush). The stock moved in your favor, but vega destroyed you.
Why it fails: High IV inflates option premiums. When IV collapses after earnings, the premium deflates even if the stock moves favorably.
Fix: Check IV rank or IV percentile before buying options. If IV is above the 70th percentile, don't buy. If you must play earnings, use a vertical spread to offset vega risk.
Mistake 4: Selling naked calls
You sell a $120 call on a $100 stock for $2.00, collecting $200. The stock announces a buyout at $140. Your broker assigns you short 100 shares at $120. You buy them back at $140 to close. Loss: $2,000 minus the $200 premium = $1,800 loss on a $200 credit.
Why it fails: Naked short calls have unlimited risk. A single gap-up can wipe out months of premium.
Fix: Only sell covered calls (own the shares) or use a call spread (buy a higher strike to cap losses).
Mistake 5: Trading illiquid options
You buy an option with a $0.80 bid and a $1.20 ask. You pay $1.20. The stock moves in your favor. The option is now worth $2.00 intrinsic, but the bid is $1.60 and the ask is $2.40. You sell at $1.60. You made $0.40 per share ($40 per contract) on a $1.00 move. The spread ate half your profit.
Why it fails: Wide bid-ask spreads are hidden transaction costs. You pay the ask to enter and receive the bid to exit.
Fix: Only trade options with volume > 100 and open interest > 500. Check the bid-ask spread before entering. If the spread is more than 10% of the option price, skip it.
Pro tips for tighter execution and better fills
1. Use limit orders, never market orders. Market orders on options fill at the ask (buying) or the bid (selling). Limit orders let you specify your price. Start with the midpoint of the bid-ask spread. If you don't get filled in 30 seconds, move your limit by $0.05 toward the ask (buying) or toward the bid (selling).
2. Trade options in the first and last hour of the day. Liquidity is highest at the open (9:30–10:30 AM ET) and the close (3:00–4:00 PM ET). Spreads tighten. You get better fills.
3. Avoid trading options on ex-dividend dates. If you're short a call and the stock goes ex-dividend, you may be assigned early because the call holder exercises to capture the dividend. This forces you to deliver shares and pay the dividend. Check ex-dividend dates before selling calls.
4. Roll losing trades only if your thesis is still intact. If you sold a $50 put and the stock drops to $45, you can roll the put to a later expiration at the same strike, collecting more premium and giving the stock time to recover. But only do this if you still want to own the stock at $50. If your thesis broke, close the trade and take the loss.
5. Track your theta decay daily. If you own options, theta is working against you every day. Check your position's theta in the morning. If you're losing $20/day to decay and the stock isn't moving, consider closing the position early rather than bleeding premium.
6. Compare your setup to vertical spreads. Before buying a naked call or put, calculate the payoff of a vertical spread (buy one strike, sell a higher/lower strike). Spreads cost less and have defined risk. Sometimes the tradeoff is worth it. For more complex multi-leg strategies, see our guide to the long butterfly option strategy, which profits from low volatility and tight ranges.
Frequently asked questions
How much money do I need to start trading options?
Minimum: $2,000 in a cash account to avoid pattern day trader rules if you're trading frequently. Realistically, $5,000–$10,000 gives you enough capital to size positions properly (1–2% risk per trade) and survive a string of losses. Accounts under $2,000 struggle because you can't scale down below one contract.
Should I trade weekly or monthly options?
Monthlies (30–45 days to expiration) are better for beginners. Weeklies decay fast—theta accelerates in the final 7 days. If the stock doesn't move immediately, you lose money to time decay. Monthlies give you time to be right. Once you're profitable with monthlies, experiment with weeklies for short-term directional plays.
Do I need Level 3 options approval to trade spreads?
Most brokers require Level 2 for vertical spreads (buy and sell calls/puts at different strikes). Level 3 is for undefined-risk strategies like naked calls and puts. If you're starting out, apply for Level 2. You can trade long calls, long puts, covered calls, cash-secured puts, and vertical spreads—enough to build a profitable strategy. For a comparison of broker platforms and approval levels, see our review of the best option trading websites.
How do I avoid IV crush on earnings plays?
Don't buy options right before earnings if IV is above the 70th percentile. If you must play earnings, use a vertical spread to offset vega risk, or wait until after earnings when IV collapses and options are cheap. Alternatively, sell options before earnings (collect high premium from elevated IV) and buy them back after the announcement when IV drops.
Can I trade options in an IRA?
Yes, but with restrictions. Most brokers allow covered calls, cash-secured puts, and vertical spreads in IRAs. Naked calls and puts are prohibited because they require margin. Check your broker's IRA options approval levels.
Putting it all together: your first 30 days
You've read the concepts. Now execute.
Week 1: Open a paper trading account. Place 10 trades using the three strategies above (long call on breakout, cash-secured put on pullback, covered call on flat stock). Track every trade in a spreadsheet: entry price, exit price, P&L, max loss, breakeven, Greeks at entry.
Week 2: Review your paper trades. Which setups worked? Which failed? Did you exit too early or too late? Did you overpay for options (high IV)? Did you trade illiquid strikes (wide spreads)? Write down three mistakes you made and three things you did right.
Week 3: Place your first real trade with real money. Risk no more than 1% of your account. Use a long call or long put (defined risk). Set a profit target (50% gain) and a stop loss (50% loss) before entering. Follow your rules. Do not move your stops.
Week 4: Place two more trades using the same strategy. Track your cumulative P&L. If you're profitable, continue. If you're losing, go back to paper trading and identify what you're doing wrong. Most beginners fail because they don't follow their own rules, not because the strategy is bad. For more structured learning paths, explore our list of the best day trading courses that cover options alongside other instruments.
Options are not get-rich-quick tools. They're leverage. Leverage amplifies gains and losses. Treat them with respect. Start small. Follow your rules. Track every trade. In six months, you'll have a repeatable process that generates consistent returns.
Related articles
- Best Option Trading Strategy: 7 Proven Setups for 2026
- Selling Options for Income: 7 Strategies That Generate Cash Flow
- Long Butterfly Option Strategy: Setup, Greeks & Profit Zones
- Best Covered Calls Stocks: 12 High-Premium Picks for 2026
Ready to automate your option strategies? Configure an AI agent in Agentic Traders to monitor IV percentiles, delta thresholds, and breakout signals, then execute your setups without watching the screen all day—start here.
Continue reading
Selling Options for Income: 7 Strategies That Generate Cash Flow
Master selling options for income with premium collection strategies, risk management, and automation. Learn covered calls, cash-secured puts, spreads, and AI execution.
StrategiesLong Butterfly Option Strategy: Setup, Greeks & Profit Zones
Master the long butterfly option strategy with strike selection, breakeven math, and volatility timing. Includes Python code, profit tables, and AI agent configuration.
Platform GuidesBest Option Trading Websites: 7 Platforms Compared for 2026
Compare the best option trading websites for 2026. Real-time Greeks, advanced order types, backtesting, and AI agent integration. Find the platform that fits your strategy.
StrategiesBest Covered Calls Stocks: 12 High-Premium Picks for 2026
Discover the best covered calls stocks for 2026 with high premiums, stable dividends, and moderate volatility. Includes Python analysis and selection criteria.
Run this strategy with an AI agent.
Configure indicators, set rules, paper-trade for free. Your agent watches the charts so you don't have to.
Launch Terminal❯❯❯